Twitter Client Usage Over Time
By: Jeff Clark Date: Fri, 06 Jun 2008
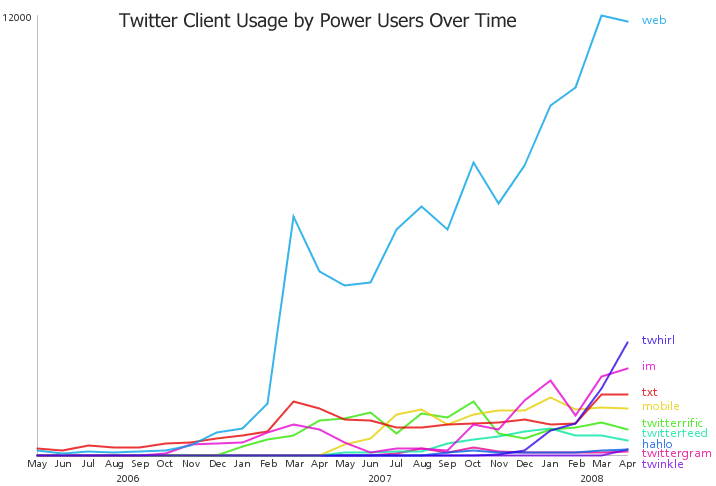
I've constructed a graph showing how use of Twitter clients by power users has changed over time. I used a dataset containing all the tweets from the power users in the Twitterific Top 100 list which was graciously provided by Yuvi, over at The StatBot. Two full years of data, from May 1st, 2006 until April 30th, 2008 were used for the analysis. The main things that jump out for me are:
- Web client use dominates
- txt client use seems to have plateaued between Mar 2006 and Mar 2008
- very rapid recent growth for Twhirl
- decent growth for im
- all the curves are fairly spiky
There have been some other recent posts giving statistics on the clients used most often to post updates to Twitter. One, from ReadWriteWeb, was called How We Tweet: The Definitive List of the Top Twitter Clients and was based on a random sample of over 37,000 tweets from the public timeline. The results were posted April 2, 2008 so I presume the data was collected shortly before then. The top 3 clients from their survey were:
Visit the original post for full results.
Yuvi, more recently, did a similar analysis based on the data he provided to me. He listed a number of findings by constrasting the two datasets including that the power users make use of both SMS txt messages (10% vs 5%) and Mobile Twitter (6% vs negligible) much more often than the typical user. He also claimed that the power users are using Twhirl less than the typical user (5% vs 7%). I believe this claim is incorrect.
The two studies mentioned above show an average client usage over very different time periods. The ReadWriteWeb study uses data from a 24 hour period around April 2, 2008 but the StatBot analysis uses a complete list of tweets that span a timeframe from March 21st, 2006 until May 25th, 2008. Drawing comparisons between two datasets based on such vastly different time periods should be done very cautiously. Twhirl is relatively new and Yuvi's analysis used lots of historical data before Twhirl was available.
The StatBot analysis showed that on average it was the 6th most popular client. In fact, if you look at the graph above at the point between Mar and Apr 2008, which corresponds to when the 'typical user' study was done by ReadWriteWeb, you can easily see that Twhirl was actually the second most popular client for power users. I've looked at the power user data for all tweets between Mar 31st and Apr 2nd, 2008 and there were 241 for Twhirl out of 1833 total - 13% , which is much higher than the ReadWriteWeb result of 7% for typical users. This makes sense to me - power users have more of an incentive to install a specialized client than an average user who doesn't use twitter very often.
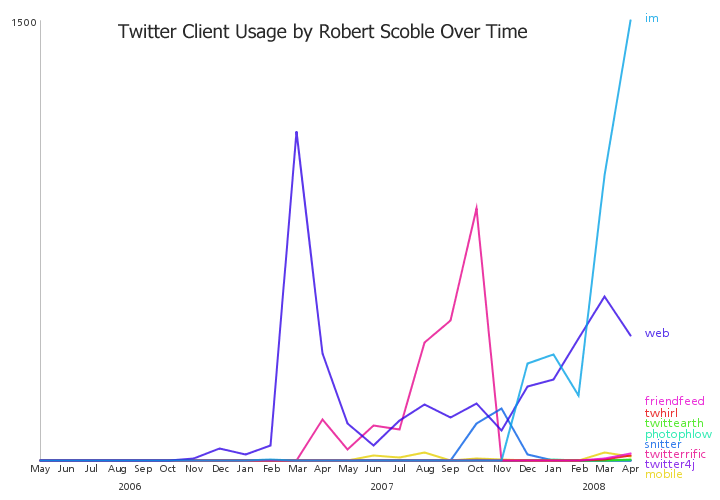
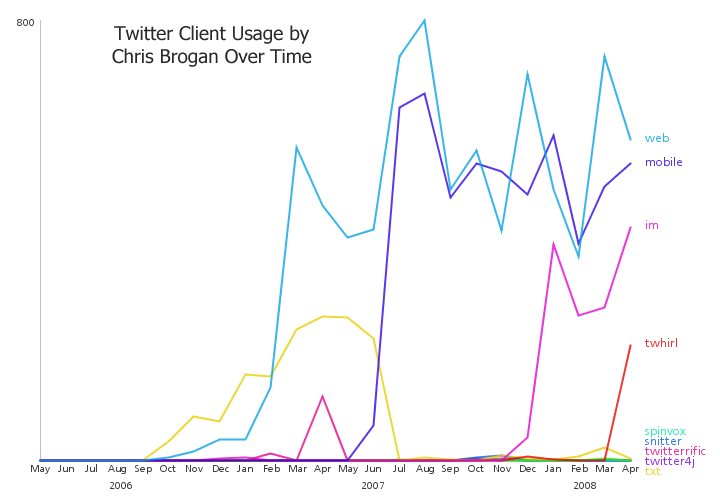
Just for fun, (well, and to try and get them to link to me ! ), I have generated graphs for two of the top power users: Robert Scoble and Chris Brogan. Note that the clients are coloured differently in the three graphs. Ideally, for easy comparison, they should be consistent. Here are a few observations concerning their patterns of use:
- Scoble has a huge peak for use of the web client around Mar 2007 and a lull in overall usage in June 2007
- Scoble switched to be a heavy user of twitterific for the last half of 2007 and again had a peak in usage
- Starting in Nov 2007 Scoble switched from twitterific to im as his primary client - web usage still common as well
- Scoble dabbles in many other twitter clients as well
- Brogan had a large drop in web client use at the same time as Scoble - Mar 2007, but didn't drop as far
- Brogan has used the mobile client a great deal since Jun 2007