Word Frequency Graphs
By: Jeff Clark Date: Sat, 17 Feb 2007
Here is a rough attempt at illustrating the meaning of some text with an automatically generated diagram.
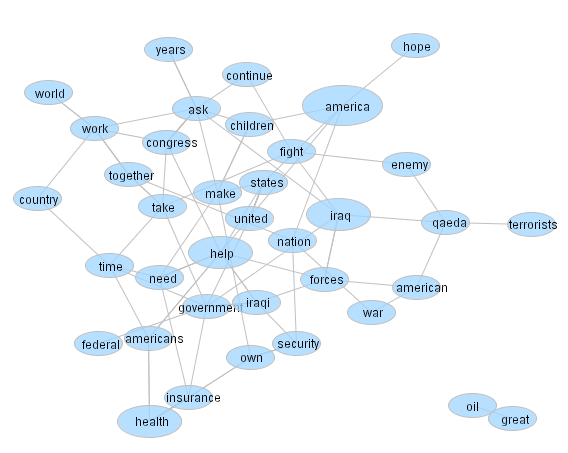
Even without an understanding of how the document was constructed much can be understood from the words that are present. A quick glance at some of the words in the bigger ovals suggests a rough idea of the topic: america, iraq, help, health, congress. The connections between some of the words give more hints: federal-government, health-insurance, fight-enemy, american-forces, united-states, ask-congress, qaeda-terrorists, iraqi-security. Notice how my brain ordered them in the way that makes the most sense, united-states rather than states-united, even though no direction is evident in the diagram connections.
The text this diagram was based on obviously includes information related to the american government and the security situation in Iraq. The fact that 'health-insurance' is prominent together with the presence of other terms like 'children' and 'congress' suggest the document wasn't focussed exclusively on the situation in Iraq. In fact, this diagram was constructed from a transcript of the 2007 State of the Union address.
Here is how it was done:
- Break the document into a stream of words.
- Throw away 'stop words' - common words that carry less meaning like (a, the, and, of, by).
- Count how many times the remaining words occur - the word frequency.
- Draw ovals for each word present where the size of the oval reflects the word frequency.
- Connect any words that appear consecutively in the document not counting the 'stop words'.
- Thow away the ovals for any words that appeared less than 9 times
- Use a force-directed layout algorithm to position the ovals with spring forces between connecting nodes and repelling forces between any non-connected nodes.
It's obviously far from ideal but this word frequency graph does give, at a glance, a rough understanding of the original text. Most of the meaning is, of course, still carried by the actual words rather than any diagrammatic elements. As discussed in my previous post, I believe the optimal short representation would be a textual summary written by an intelligent person.
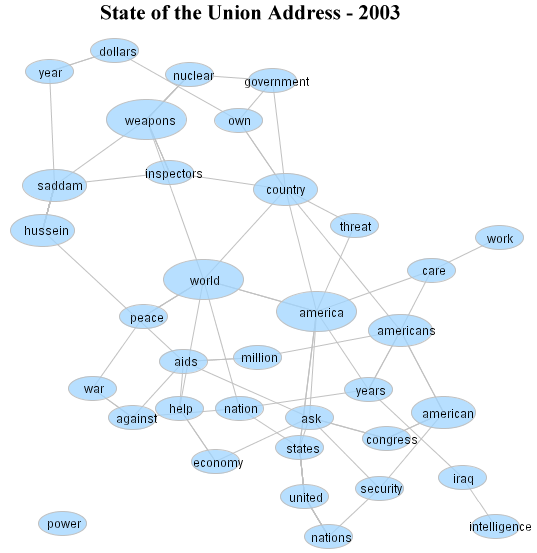
Here is a similar graph for the State of the Union address in 2003: