Another Box Office Graphic
By: Jeff Clark Date: Fri, 01 Aug 2008
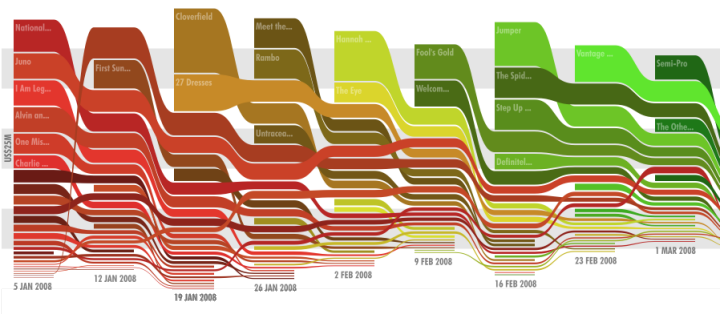
Zach Beane has created another variation on a graphic to illustrate movie box office data. See Movie box office charts for the original but here are a few interesting bits:

In Zach's words:
Each page displays trends in the top 25 movies at the box office for each weekend in a year. The color is based on the movie's debut week. Because of that, long-running movies will gradually start to stand out from newer movies with different colors.There is an interactive version as well.
Related posts: Movies Ebb and Flow