Radial Treemaps
By: Jeff Clark Date: Tue, 11 Apr 2006
In the previous post I briefly described an application based on a type of visualization called a Treemap. They are definitely a useful technique in the right context but after exploring them a bit I found the generated images a bit unsatisfying. The things that I dislike about them are:
- the irregularity of the layout
- the hierarchies are not clearly expressed
- it's difficult to illustrate multi-level hierarchies
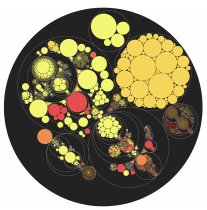 Problems 2 & 3 are nicely addressed by a variation which Kai Wetzel
calls a Circular Treemap.
This design has the obvious drawback that the visualization is no longer
space-filling - you can't fit as much information into the same area as with
the standard rectangular treemap.
Problems 2 & 3 are nicely addressed by a variation which Kai Wetzel
calls a Circular Treemap.
This design has the obvious drawback that the visualization is no longer
space-filling - you can't fit as much information into the same area as with
the standard rectangular treemap.
Another variation that occurred to me which sacrifices some information density for perhaps a more natural form is what I have called a 'Multi-Level Pie Chart'. I created an implementation of this technique and found it a reasonably satisfying approach for visually exploring hierarchical data. I'll describe it in detail in a future post. If you just can't wait any longer then you can get some flavour of the idea by investigating the Sunburst Project from Georgia Tech.